This series of posts aims to talk about the concept and applications of graph neural networks (GNNs), which is a machine learning model applied to graph-structured data. The series consists of three parts:
- Part I explains what graph-structured data is and how it is represented. This part also introduces the concept of graph machine learning and GNNs.
- Part II provides more details on a variant of GNNs called graph convolutional networks (GCNs).
- Part III, which is this part, describes various applications of GNNs to real-world data, categorized by the task levels mentioned in the first part.
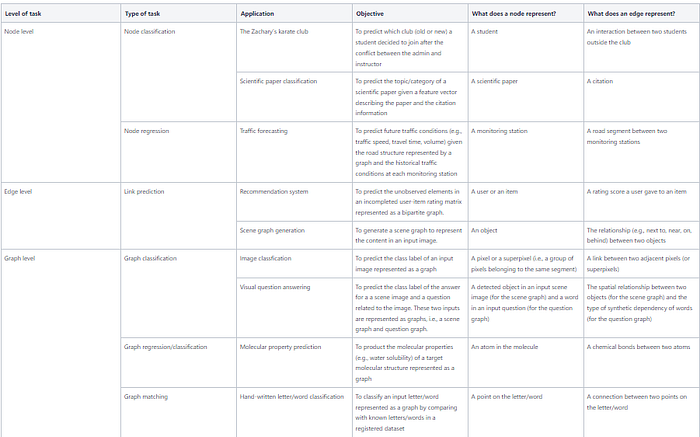
1. Node-level tasks
A node-level task aims at predicting some properties of nodes in a graph input. The predictions can be discrete class labels, i.e., node classification, or continuous quantities, i.e., node regression.
1.1 Node classification
Zachary’s karate club: A popular example of node classification is Zachary’s karate club problem [1]. In this problem, a graph describing the social relationship between 34 members, including the admin and instructor, of the karate club is given. An edge between two members signifies their interactions outside the club. After a serious conflict between the admin and the instructor of the club, the club was split into two; half of the members joined a new club founded by the instructor while the remaining stayed with the admin who hired a new instructor to teach the members. The task is to predict which club (old or new) each member other than the admin and the instructor decided to join.
Scientific paper classification: Another possible application of graph ML is to classify the topic of a scientific paper given a graph describing the citation relations between papers. A node on the graph represents a scientific paper. Each node is associated with a feature vector, for example, a TF/IDF weighted word vector or a binary vector denoting if the paper contains some keywords. An edge on the graph, which is undirected and unweighted, represents a citation. Two notable datasets for this task include the Cora and PubMed datasets. In the Cora dataset, a graph representing machine learning papers with seven class labels (e.g., genetic algorithms, neural networks, reinforcement learning) is given. It consists of 2,708 nodes and 5,429 edges. In the PubMed dataset, a larger graph with 19,717 nodes and 44,338 edges is given, but the number of class labels to predict is smaller, only three classes (i.e., diabetes experimental, diabetes type 1, and diabetes type 2 papers). An example use of graph ML to solve these problems is reported by Monti et al. [2].
1.2 Node regression
Traffic forecasting: Recently, Cui et al. [3] reported an application of a graph neural network (GNN) to perform traffic forecasting. A graph is used to model the traffic condition of the road network, in which a node represents a monitoring station and an edge represents a road segment describing how two monitoring stations are connected. Each monitoring station exploits some sensors to obtain traffic conditions (e.g., traffic speed, travel time, volume). Given historical traffic conditions and the road structure represented by the graph, Cui et al. [3] trained a GNN to process the graph and predict future traffic conditions at each monitoring station (Fig. 1).

2. Edge-level tasks
While a node-level task aims at predicting a property of each node, an edge-level task focuses on predicting the existence of an edge between two nodes or predicting some properties of associating with an edge on a graph input. Edge-level tasks are often referred to as link prediction problems.
2.1 Link prediction
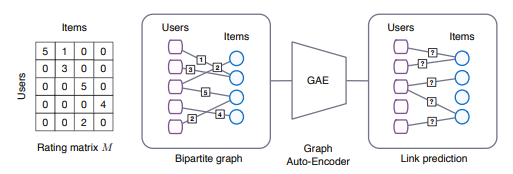
Recommendation system: Collaborative filtering is an approach for building a recommendation system. It can predict how a user would like a target item based on the preference or rating information of many other users. This rating information can be represented as a user-item matrix, in which an element (i, j ) on the matrix indicates the rating score of a user i on an item j. Usually, this matrix is incomplete since we cannot collect this information from all users on all items; therefore, a matrix completion technique is required. As shown in Fig. 2, van den Berg et al. [4] proposed to treat this problem as a link prediction problem. A bipartite graph of users and items is created based on the observed rating scores in an incompleted rating matrix. This graph is then passed into a trained GNN to predict the rating scores of unobserved links.
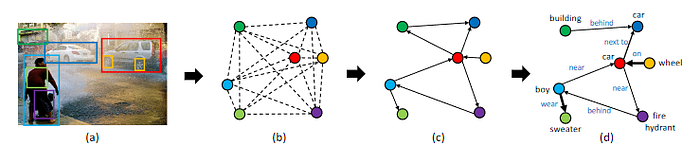
Scene graph generation: Yang et al. [5] made an attempt to use a GNN to generate a scene graph to represent the content in an input image. As shown in Fig. 3, their method first applies an object detector to detect objects appearing in the input image. An initial graph, in which a node represents a detected object and each node is connected to each other via an edge. The initial graph is then pruned to remove unlikely relationships between objects. An attention-based graph convolutional network (GCN) is then used to process the pruned graph and predict the edge labels that represent the relationships (e.g., near, behind, next to) between objects.
3. Graph-level tasks
As described in the previous sections, node-level and edge-level tasks predict some properties or values associated with each node or each edge, respectively. A graph-level task, however, considers an input graph as a whole and aims to predict its properties. On the one hand, if a property to predict is of discrete class labels, we call this task a graph classification task. On the other hand, if it aims to predict a continuous property of a graph, it is called a graph regression task. In addition, a graph-level task may aim at comparing two input graphs and computing a distance or similarity between them. This kind of task is referred to as graph matching.
3.1 Graph classification
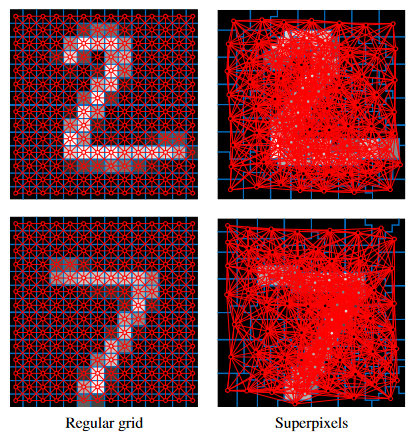
Image classification: Monti et al. [2] reported an application of graph ML to solve an image classification problem. They experimented with a well-known hand-written digit classification dataset called MNIST. An input image is represented as a graph. As shown in Fig. 4, they experimented with two graph structures: 1) a regular-grid structure in which each pixel represented as a node is connected to its eight neighbors on the grid, and 2) a superpixel structure in which a node represents a superpixel (i.e., a group of nearby pixels that belong to the same segment) and an edge exists between two connected superpixels. A GCN with three graph convolutional layers interleaved with graph pooling layers is used to process an input graph to predict its class label.
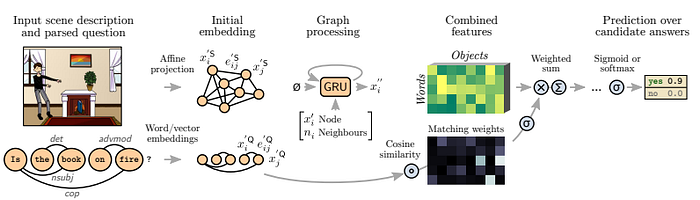
Visual question answering: Teny et al. [6] proposed a GNN-based method to solve a visual question answering (VQA) task. In their VQA setting, two inputs are given, i.e., 1) an input scene image and 2) a question related to the scene image, while the output is the class label of the answer from a predefined list of possible answers. As shown in Fig. 5, two graphs, namely a scene graph and a question graph, are fed into a GNN to process the graphs and finally predict the answer to the input question given the scene image. In the scene graph, a node represents a detected object in the scene while an edge represents the spatial relationship between two objects. In the question graph, a node represents a word in the input questionwhile an edge represents the type of syntactic dependency, e.g., determiner (det), adverbial modifier (advmod), or nominal subject (nsubject), between two words. Their GNN model supports various types of answers, including yes/no, number, and others.
3.2 Graph regression
Molecular property prediction: Yang et al. [7] reported an application of GCNs to predict the molecular properties of a given molecule represented as a graph structure, in which a node represents an atom in the molecule and an edge represents the chemical bond between two atoms. Properties of an atom (e.g., atomic mass, atom type, the number of bonds the atom is involved in) are utilized to construct a feature vector to describe it. Similarly, each chemical bond is associated with a feature vector describing its properties such as bond type. The molecular properties to predict can be in the form of either discrete class labels (classification) and/or continuous quantities (regression). Experimentation on 19 public and 16 proprietary industrial data indicates promising results, comparing other ML models such as random forests or feed-forward neural networks.
3.3 Graph matching
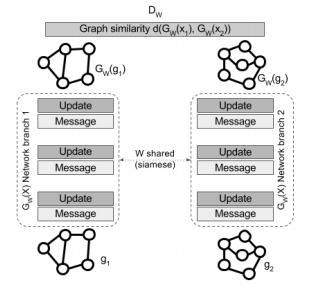
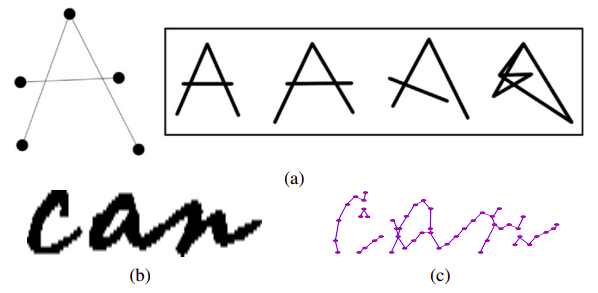
Hand-written letter/word classification: Riba et al. [8] reported the use of a GNN-based method to compute the edit distance between two graphs (Fig. 6). This edit distance tells us how similar the two graphs are. They exploit a Siamese-network consisting of two identical GNNs to solve these graph matching tasks. They also reported an application of their network on hand-written letter and word classification tasks. As shown in Fig. 7, a letter or a word is represented as a graph. In this case, a node represents a 2D position of a point on the letter or word, while an edge denotes the connection between two points. Classification is done by feeding a graph of an unknown letter/word and a graph representing each known letter/word registered in their system to compute their similarity. The class label of the letter/word that yields the best similarity score is the predicted answer.
4. Summary
We have introduced several applications of GNNs, categorized by the levels of tasks, i.e., node, edge, and graph levels. In each application, we have explained what kind of data to be represented as a graph, what nodes and edges represent, and how to use a GNN to solve the task. The above table summarizes all applications we discussed in this part, which is the final part of the series.
References
Written by: Sertis Vision Lab
Originally published at https://www.sertiscorp.com/